cloudcostdb
LiveAWS pricing, made browsable.
Compare EC2, RDS, storage, networking and Bedrock model pricing across every AWS region. No sign-up, no spreadsheets. Built as a static site on AWS's public pricing data.
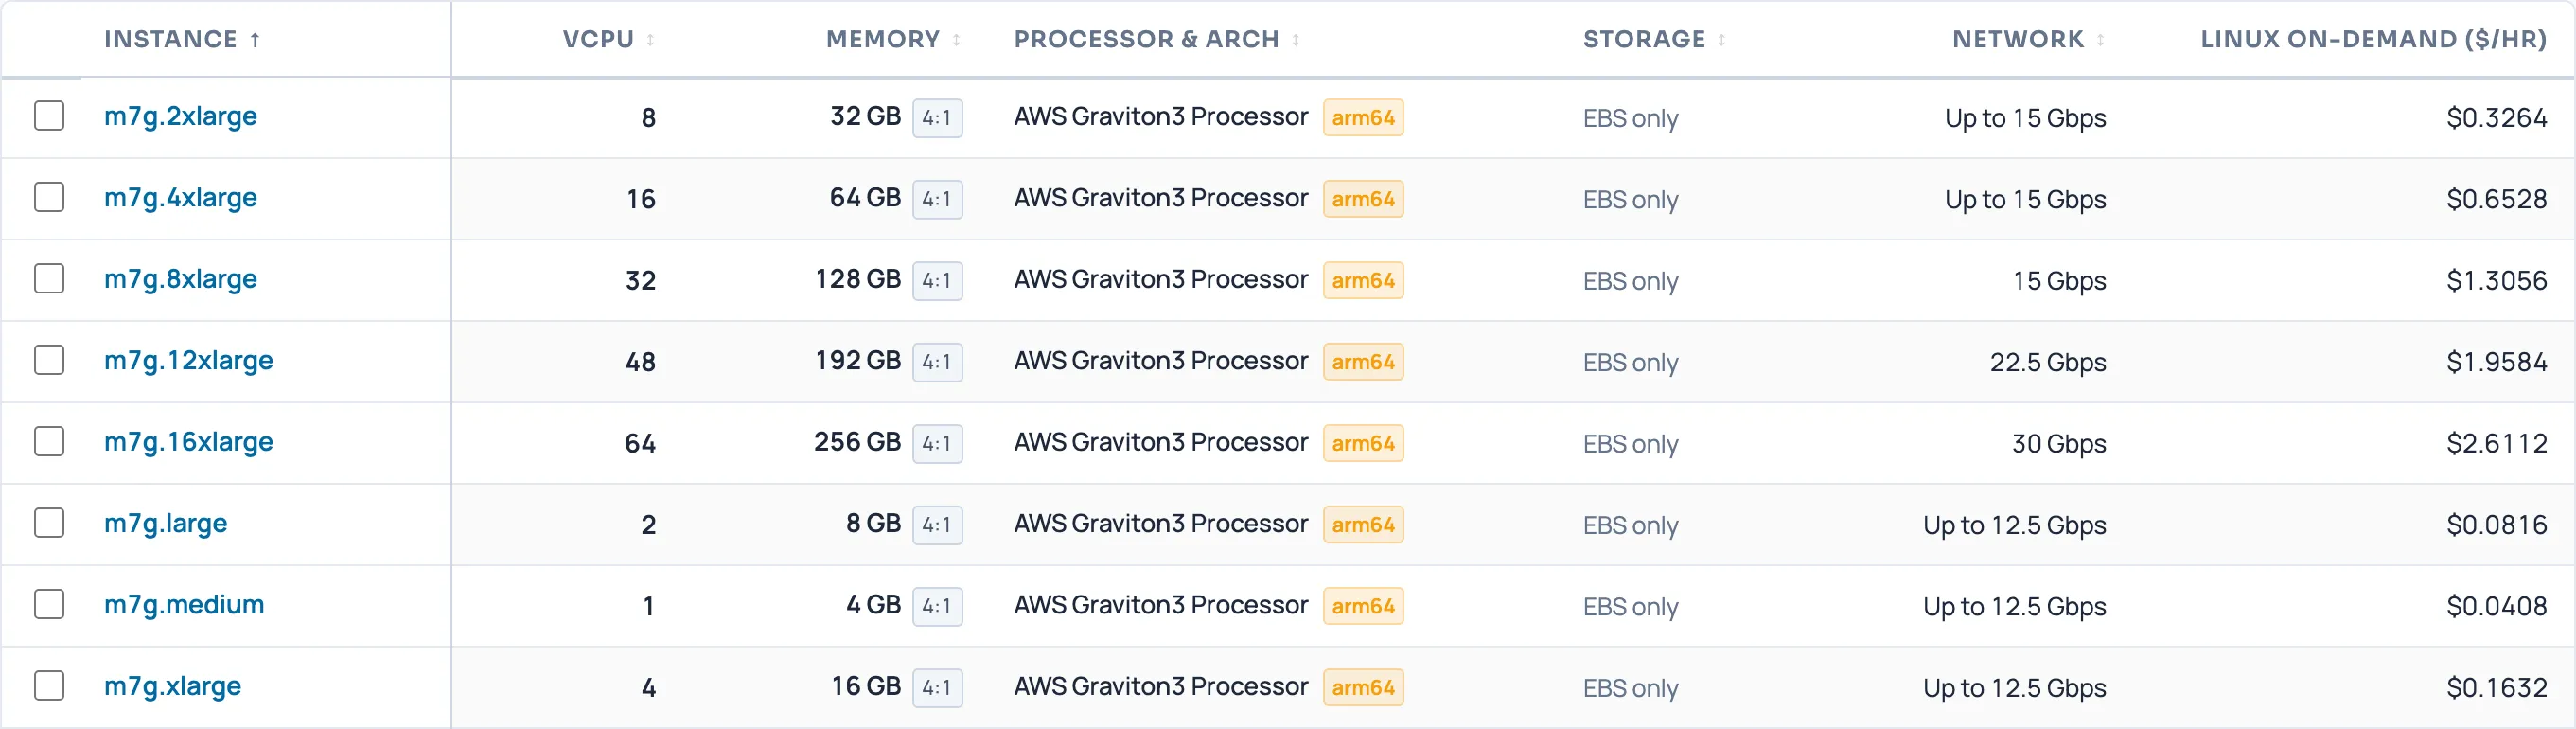
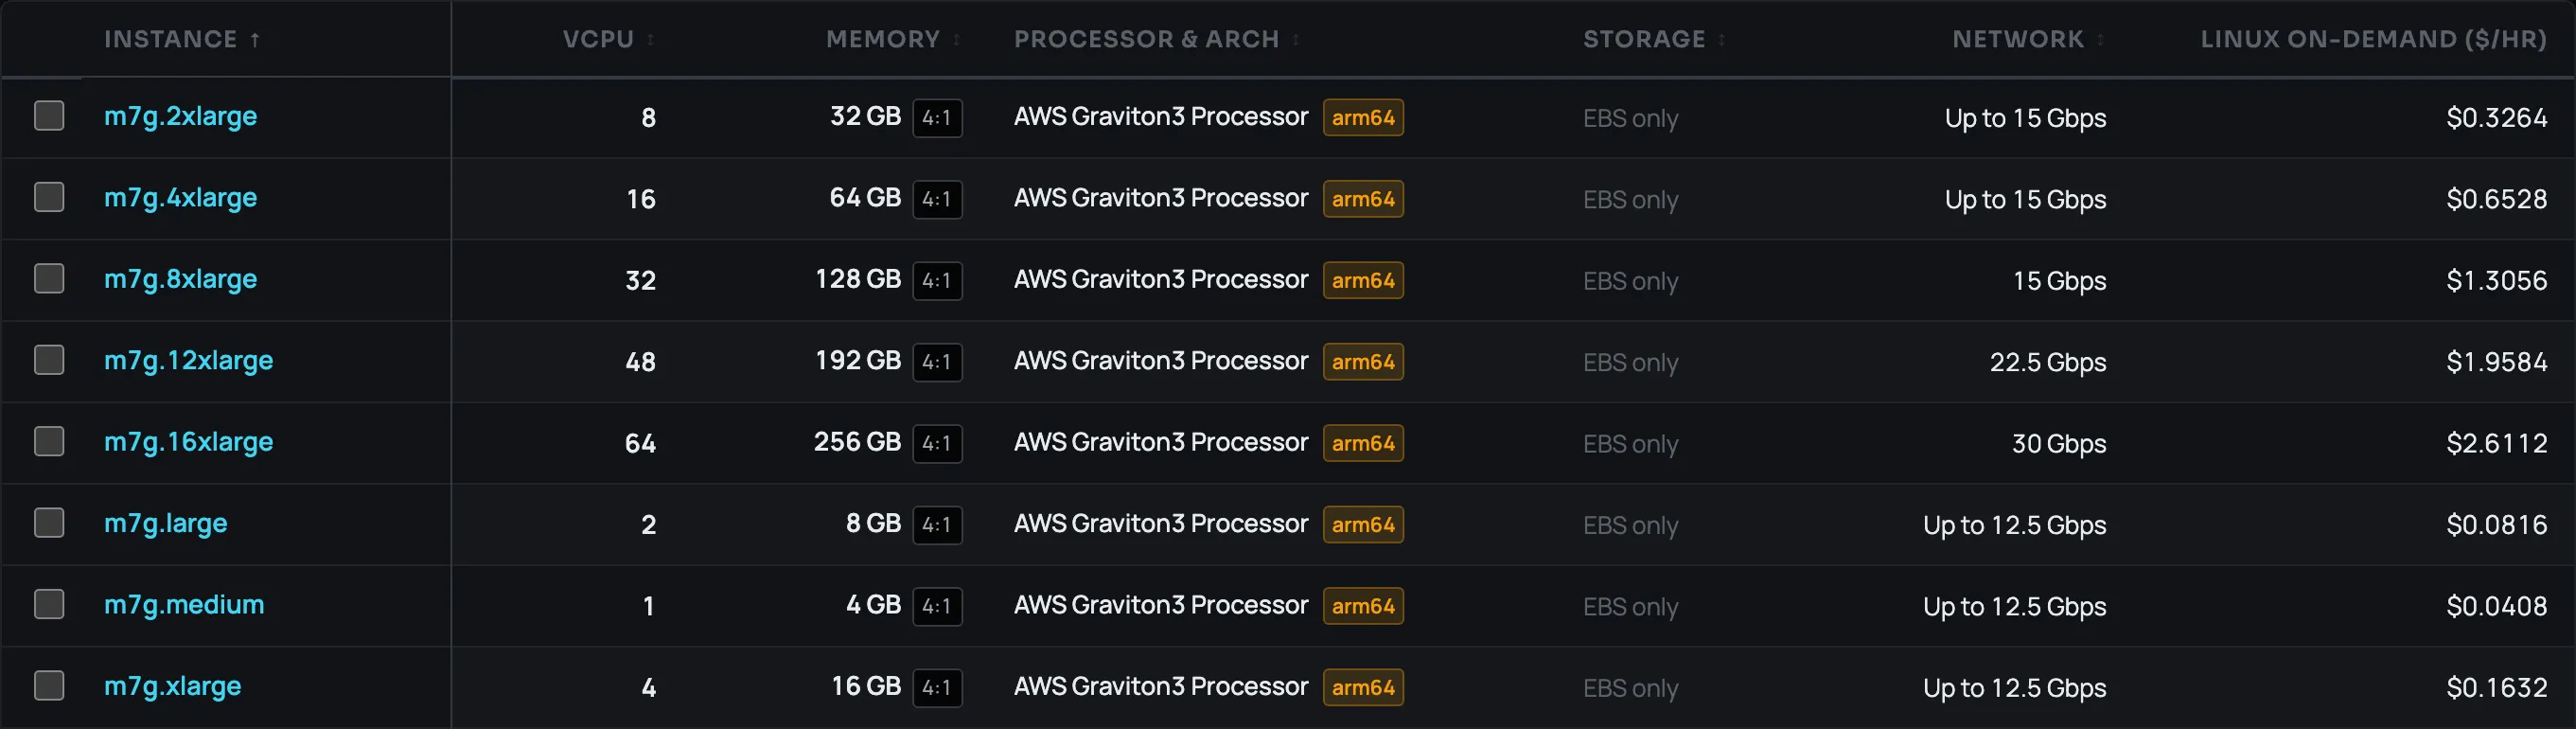
m7g in us-east-1.

AOTC Labs · Ahead of the Curve
An independent lab building free tools for FinOps and cloud engineers. Pricing data you can actually browse, and test data you can actually trust.
Two tools so far, both about making AWS cost easier to see and test.
AWS pricing, made browsable.
Compare EC2, RDS, storage, networking and Bedrock model pricing across every AWS region. No sign-up, no spreadsheets. Built as a static site on AWS's public pricing data.
m7g in us-east-1.Synthetic AWS Cost and Usage Reports, with ground truth.
Simulates infrastructure being created, scaled and torn down, then emits the CUR that would result. Every run also records which change caused which cost delta, so you can test anomaly detection and cost tooling against a known answer.
$ uv run curgen run --scenario=scenarios/teaching/cost_change_detection.yaml --output=./output
[CURGen] Scenario: Cost Change Detection Teaching Scenario
[CURGen] Seed: 42 (deterministic mode)
[CURGen] Duration: 72 hours
[CURGen] Scripted events: 5
[CURGen] Simulation complete!
[CURGen] Total resources created: 15
[CURGen] Scripted events: 5 scheduled, 5 executed, 0 matched no resources, 0 refused on a selected resource
[CURGen] Pricing fallbacks: 0

$ jq -c 'select(.event_type == "hourly_checkpoint" and .hour > 1
    and .cost_delta_from_previous_hour != 0)
    | {hour, delta: (.cost_delta_from_previous_hour * 1000 | round / 1000)}' \
    output/*/ground_truth/*.jsonl
{"hour":13,"delta":0.48}
{"hour":24,"delta":-0.052}
{"hour":36,"delta":-0.192}Numbers come from AWS's own pricing feeds and billing formats, not marketing pages.
Deterministic output, stated sources, tests. If a number looks wrong, you can trace it.
Built in public as side projects, for the FinOps community. No accounts, no paywalls.